
Product · 2024
Reel Propagation Visualiser — Conciptual Experiment
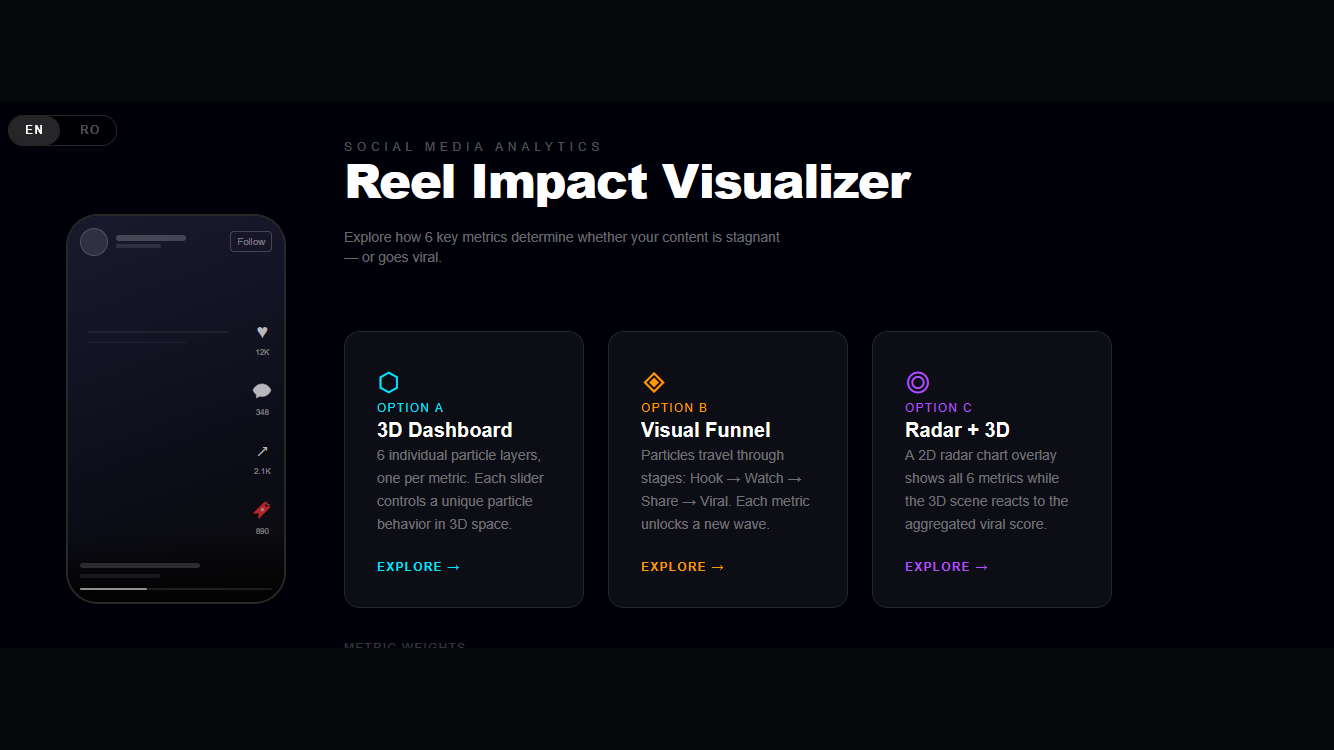
An internal experiment by Conciptual Ltd — a Three.js-powered interactive visualiser that models how six key engagement metrics drive the viral propagation of short-form video content across social platforms.
What this is
The Reel Propagation Visualiser is an internally developed tool — built by the Conciptual team, but publicly available and free to use. It serves as both a technical exploration and a practical educational resource: a visual, interactive way for potential clients to understand, at a glance, how a well-crafted and well-distributed Reel actually propagates across a platform — and what separates content that reaches thousands of new people from content that quietly disappears after Wave 1. It models how six key engagement metrics interact to determine whether a piece of short-form video content reaches a small audience and stops, or triggers the successive distribution waves that characterise genuine virality.
It was built for two reasons: to deepen our practical understanding of Three.js and real-time 3D rendering in the browser, and to create a visual, interactive way to communicate something we explain to clients regularly — how social algorithms actually work, and why most content never leaves Wave 1.
Three ways to explore the data
The visualiser offers three distinct modes, each representing the same underlying model through a different lens:
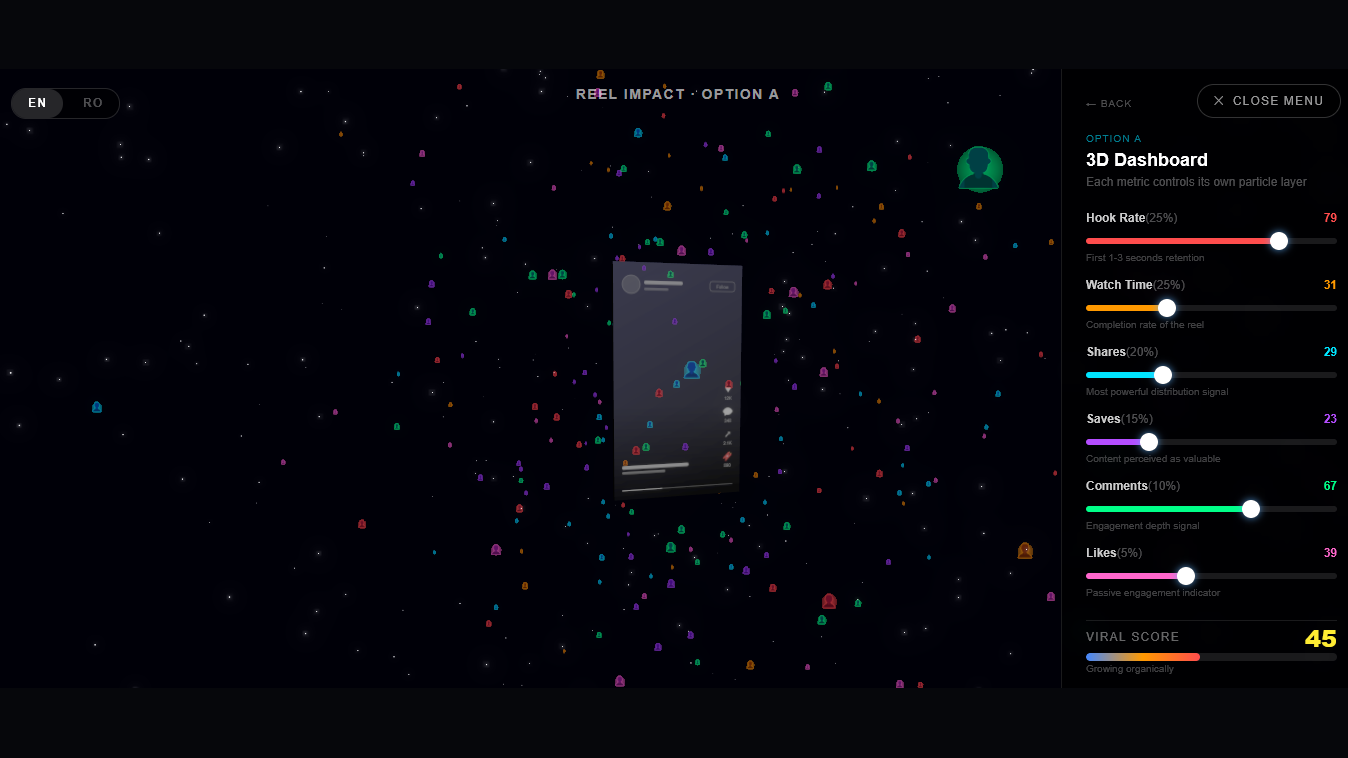
Option A — 3D Dashboard. Six individual particle layers, one per metric. Each slider controls a unique particle behaviour in 3D space — adjusting hook rate, for example, changes the density and velocity of the first particle layer in real time. The result is an immediate, visceral sense of how each metric contributes to the overall system.
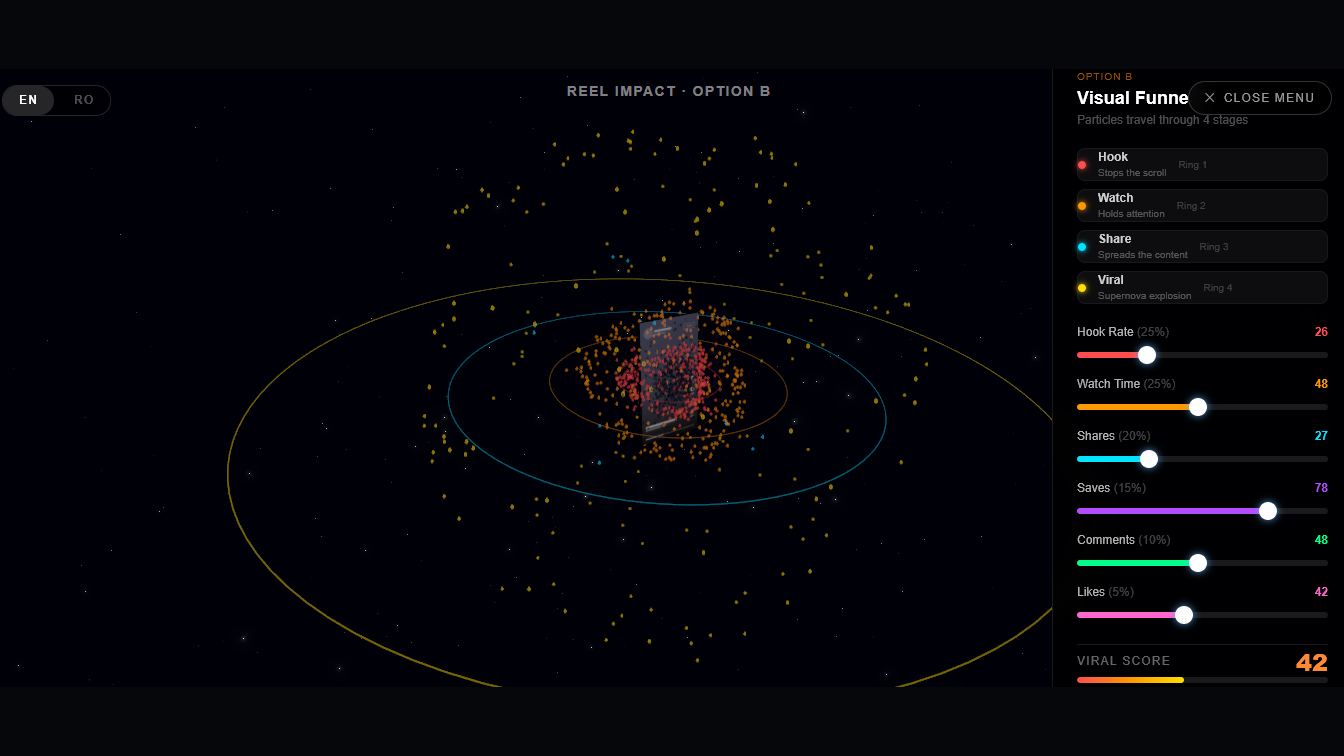
Option B — Visual Funnel. Particles travel through four sequential stages: Hook → Watch → Share → Viral. Each metric unlocks a new wave of particles, making the propagation model explicit — you can see exactly where content drops out of the funnel and why.
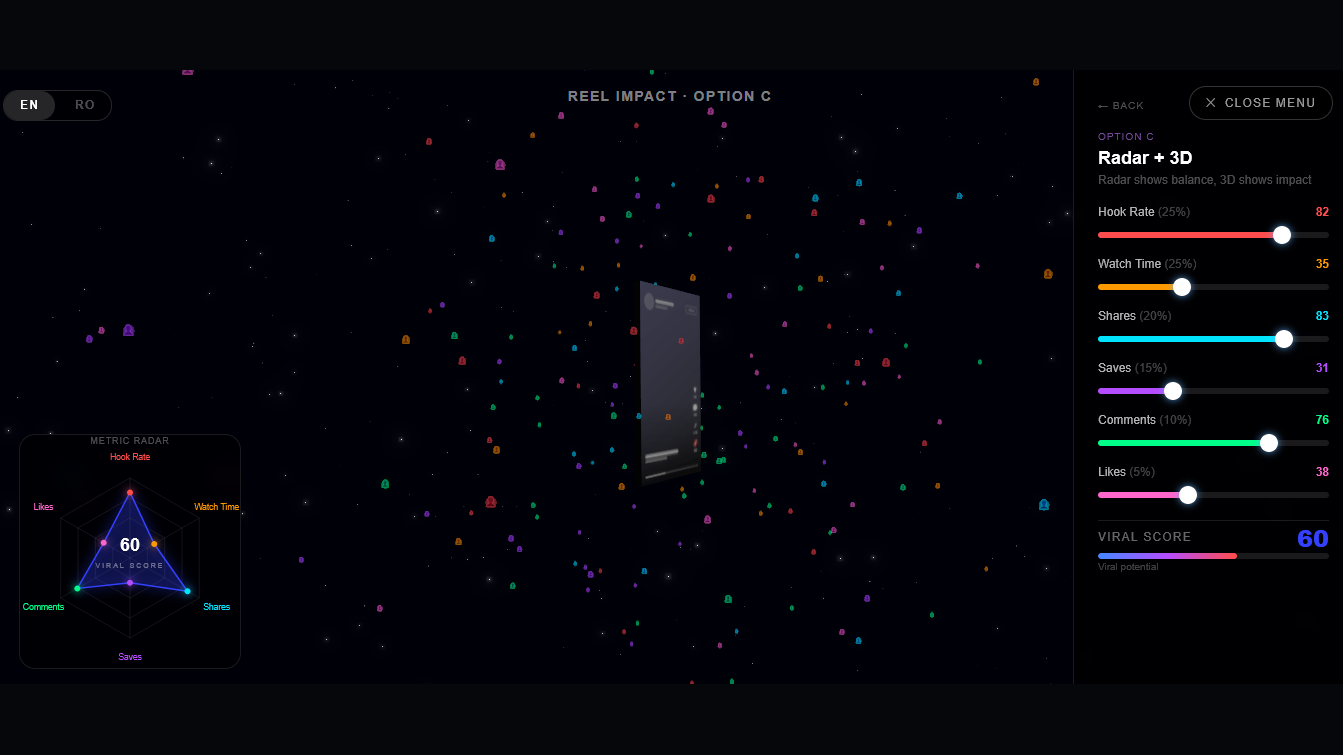
Option C — Radar + 3D. A 2D radar chart overlay displays all six metrics simultaneously while the 3D scene reacts to the aggregated viral score. This mode is the most analytical — useful for comparing profiles and understanding the combined effect of metric combinations.
The six metrics and their weights
The model is built around six engagement signals, weighted to reflect their relative importance in the distribution algorithms of Instagram, TikTok, YouTube Shorts and Meta Reels:
| Metric | Weight |
|---|---|
| Hook Rate | 25% |
| Watch Time | 25% |
| Shares | 20% |
| Saves | 15% |
| Comments | 10% |
| Likes | 5% |
Hook rate and watch time carry the most weight because they are the signals the algorithm evaluates first — in the narrow window of the initial test audience — before deciding whether to push content to a wider pool.
Understanding virality
Virality is not a view count. It is the point at which organic sharing outpaces algorithmic distribution — when people share the content faster than the platform needs to push it. Distribution happens in waves: Wave 1 reaches roughly 500–2,000 accounts; if engagement clears the threshold, Wave 2 reaches 10,000–50,000; Wave 3 can reach hundreds of thousands. Each wave is triggered by the performance of the previous one, and the window is narrow — typically the first 24 to 48 hours after posting.
The difference between strong and mediocre performance is stark. A hook rate of 85% and watch time of 78% can push content through four or more distribution waves, reaching audiences 50–200× the creator’s follower count within 48 hours. A hook rate of 31% and watch time of 28% stops the algorithm after Wave 1 — the content stays inside the existing follower bubble and generates no new audience exposure.
A note on methodology
The model is based on years of direct observation, client campaign analysis and platform experimentation by the Conciptual team, supplemented by available industry research and creator studies. No one outside the platforms has access to the exact internal workings of these algorithms. What the visualiser presents is an evidence-based model — accurate enough to be actionable, honest enough to acknowledge its limits.
Why we built it
Internal experiments like this serve a dual purpose. They push the team into technologies — Three.js, WebGL, real-time particle systems — that sit outside the typical client project scope, building capability that feeds back into commercial work. And they produce tools that make abstract concepts tangible: showing a client why their content is not performing is considerably more effective when you can let them move a slider and watch the particles stop.